


Every year, June and December are set to be environmental protection awareness months for promoting various energy saving and carbon reduction policies to our employees. Eurocharm also sets and manages specific annual energy-saving targets for each production base and tracks emission reduction performance, discloseed publicly on the Company’s website. In 2022, we officially implemented the ISO 14064-1 greenhouse gas inventory and engaged a third-party verification by TUV NORD and BSI. Therefore, 2022 was chosen as the baseline year for the disclosure.
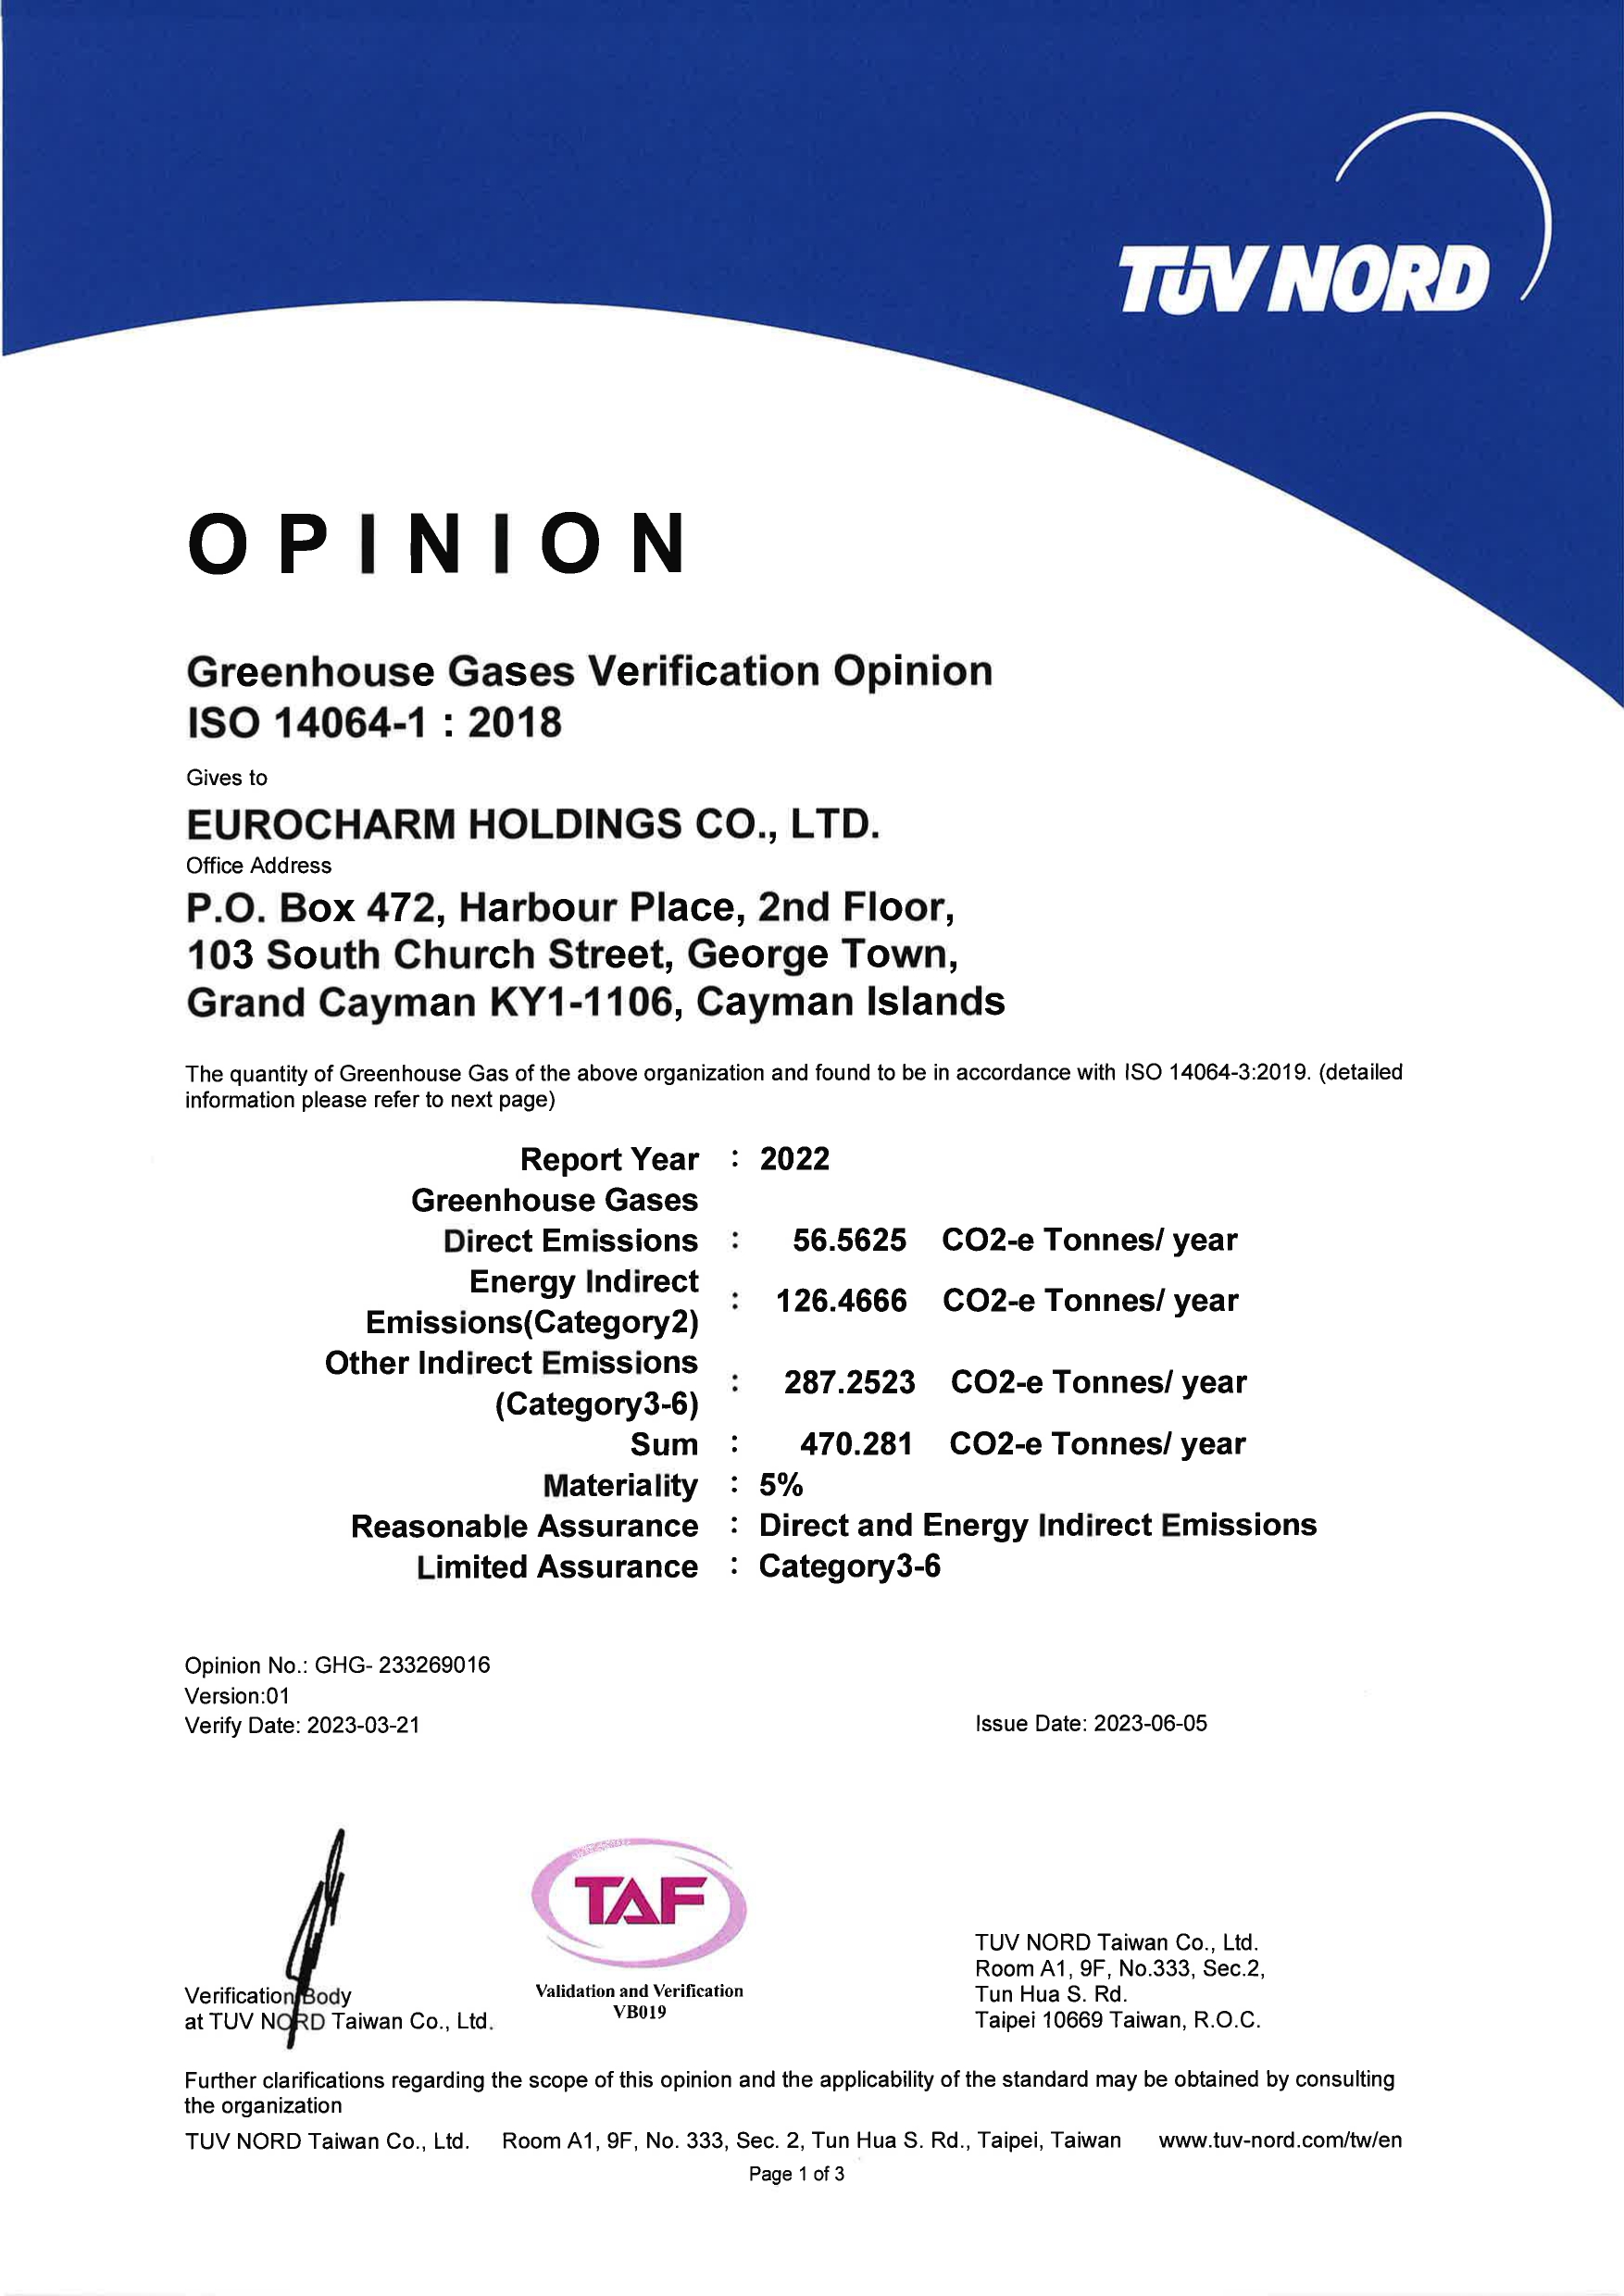
ISO 14064-1 Verification Statement(Eurocharm KY, B.V.I, Eurocharm US, Eurocharm HK, Eurocharm TW)
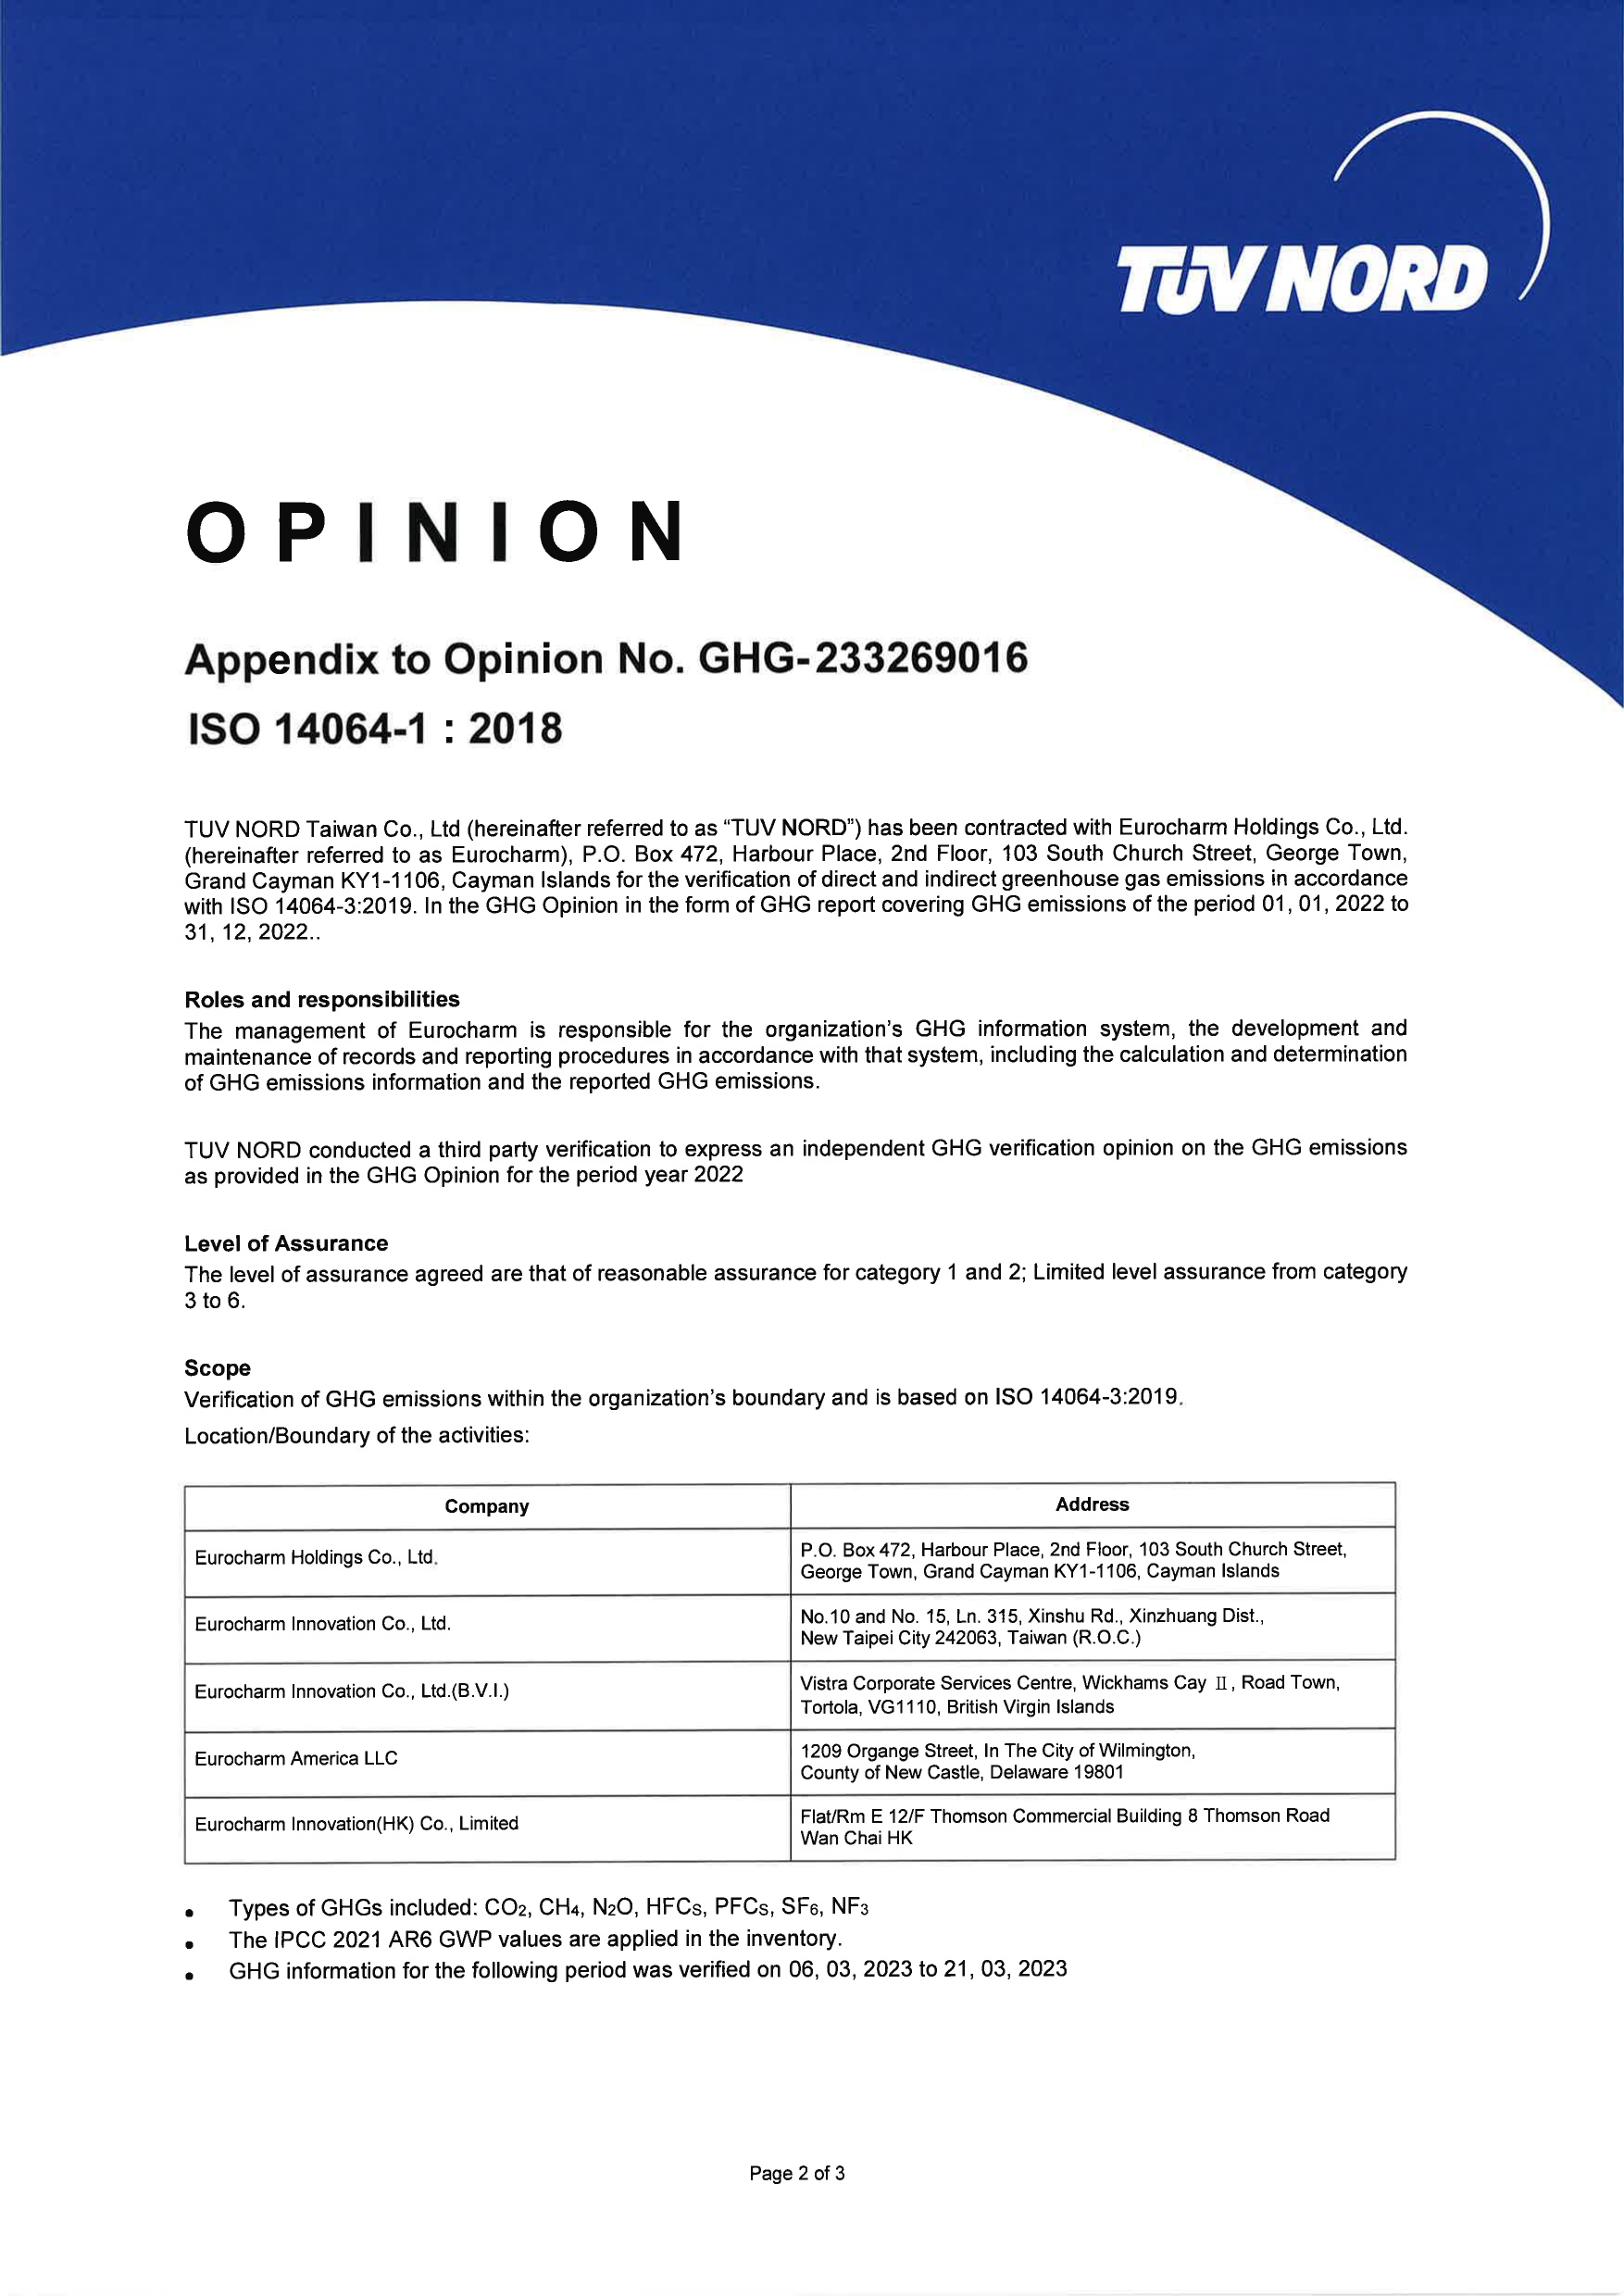
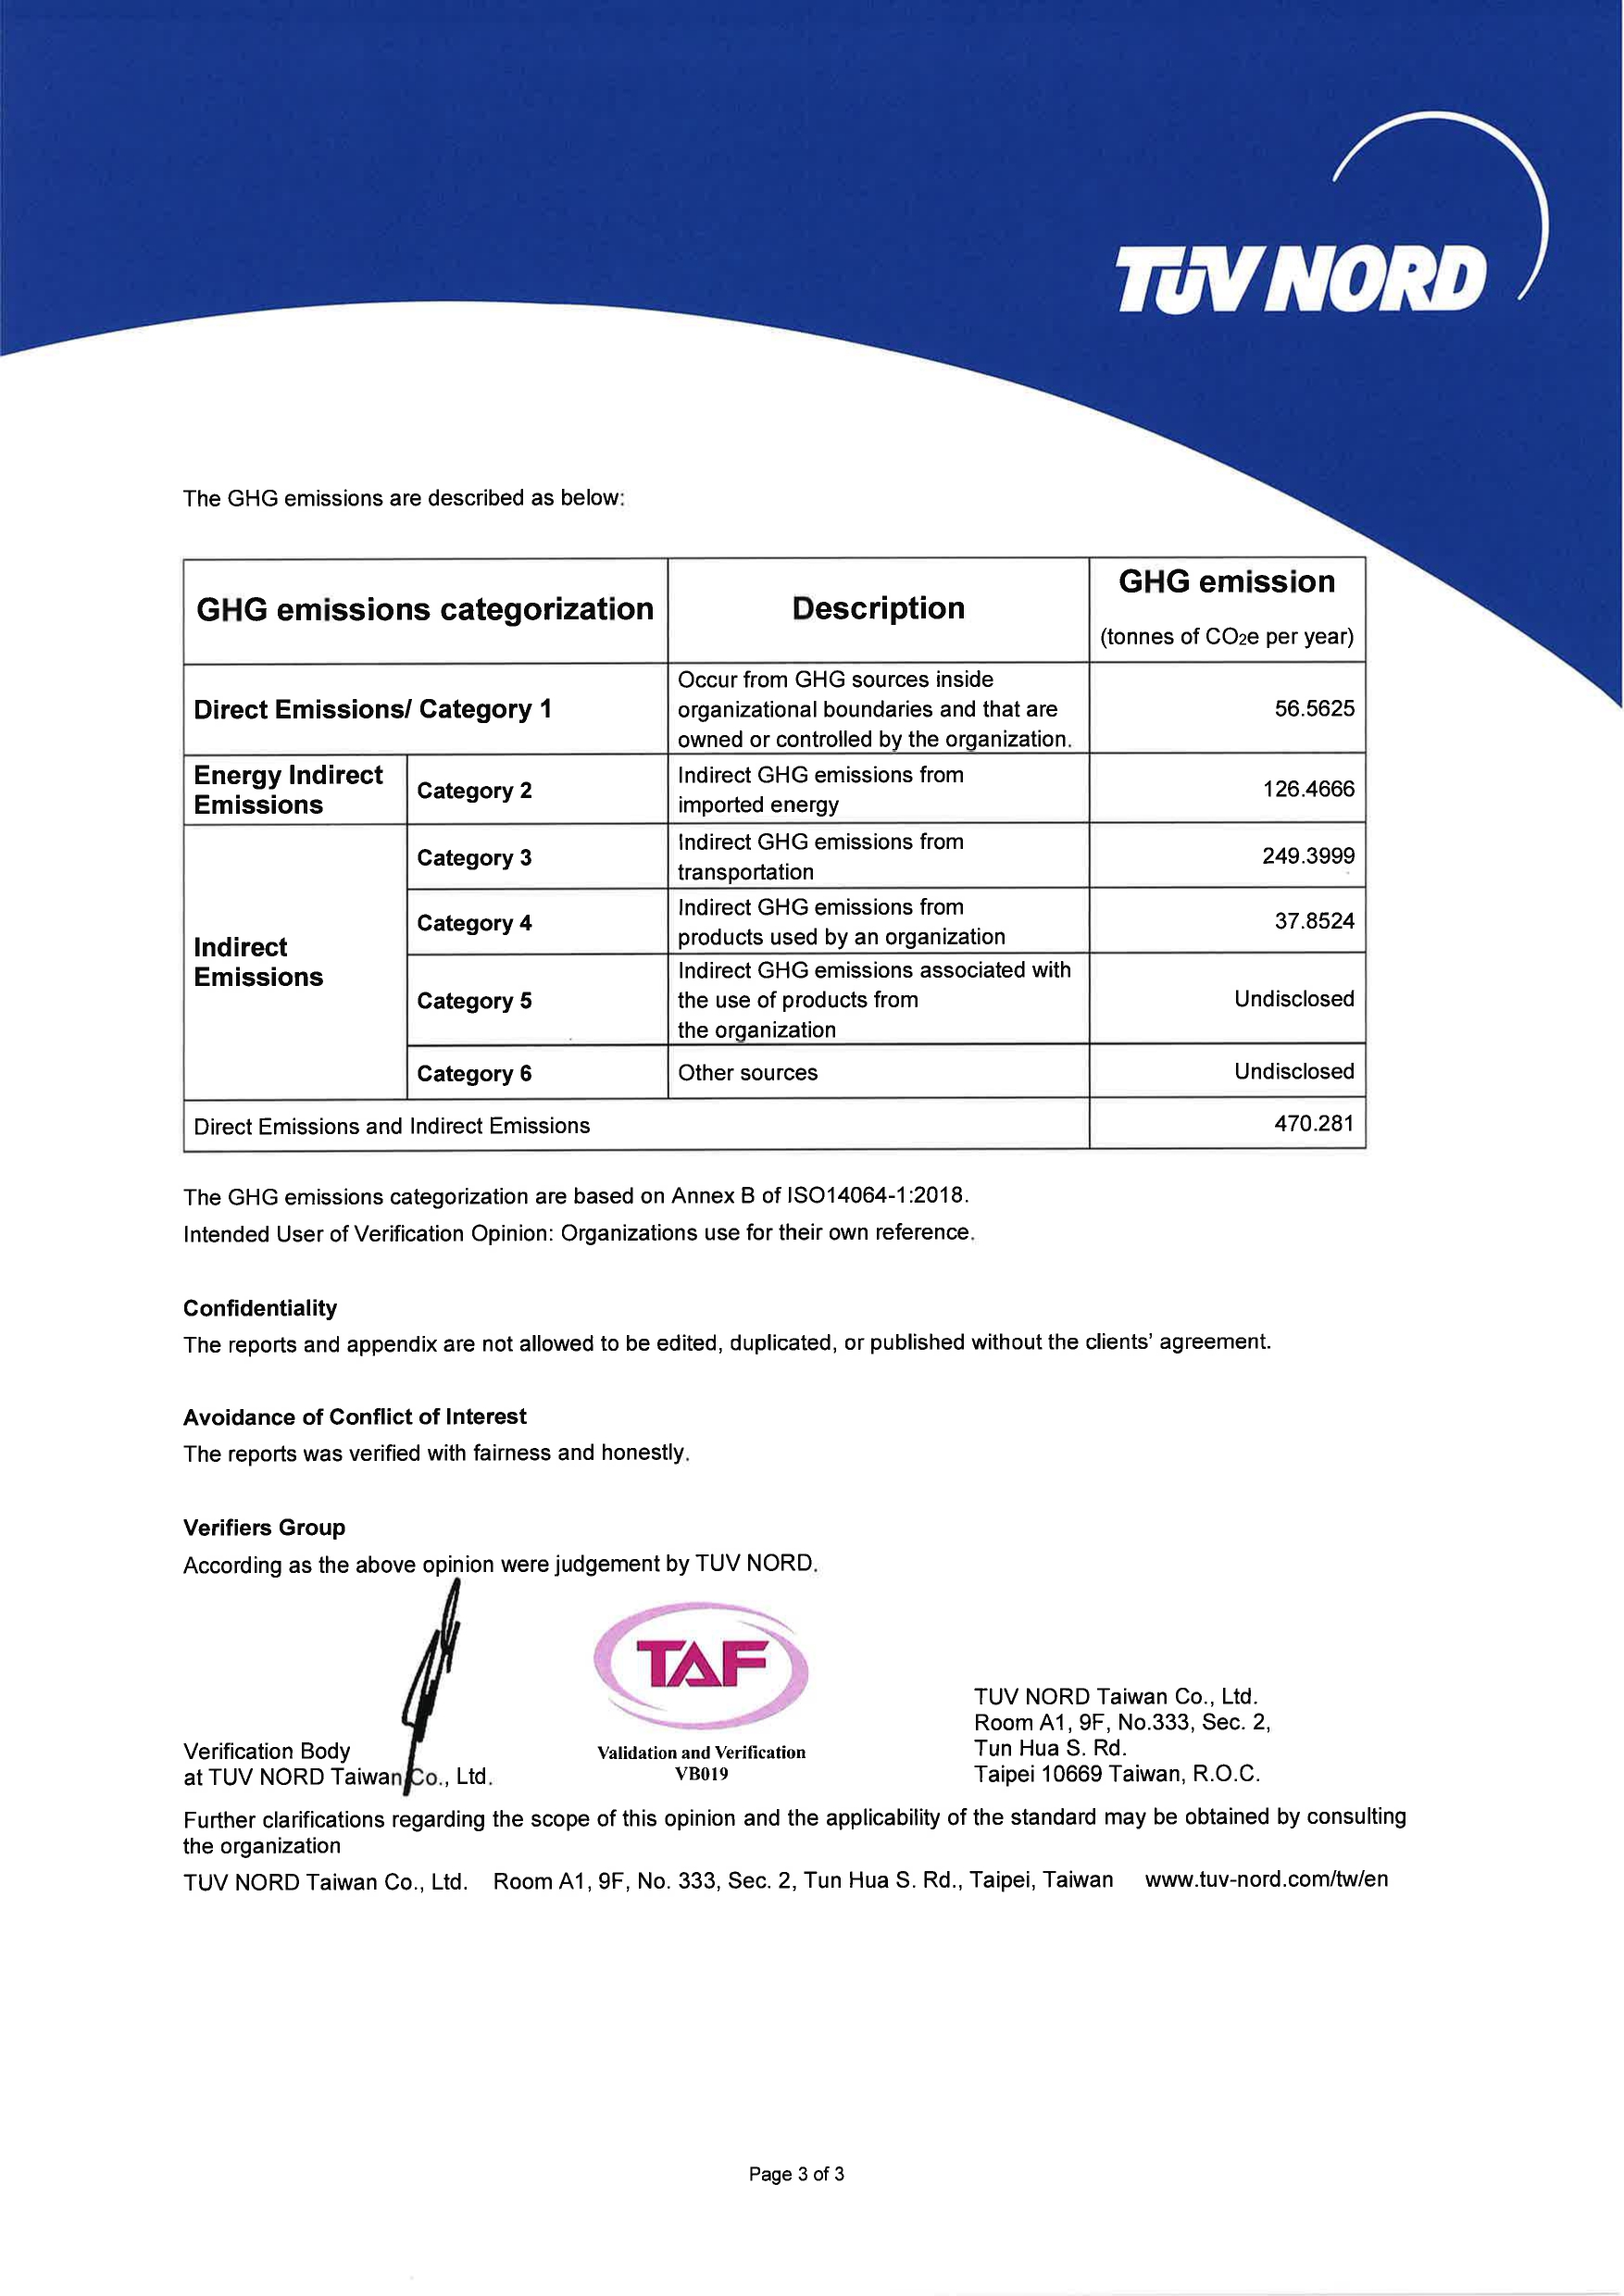
2022 GHG Report(Eurocharm KY, B.V.I, Eurocharm US, Eurocharm HK, Eurocharm TW)
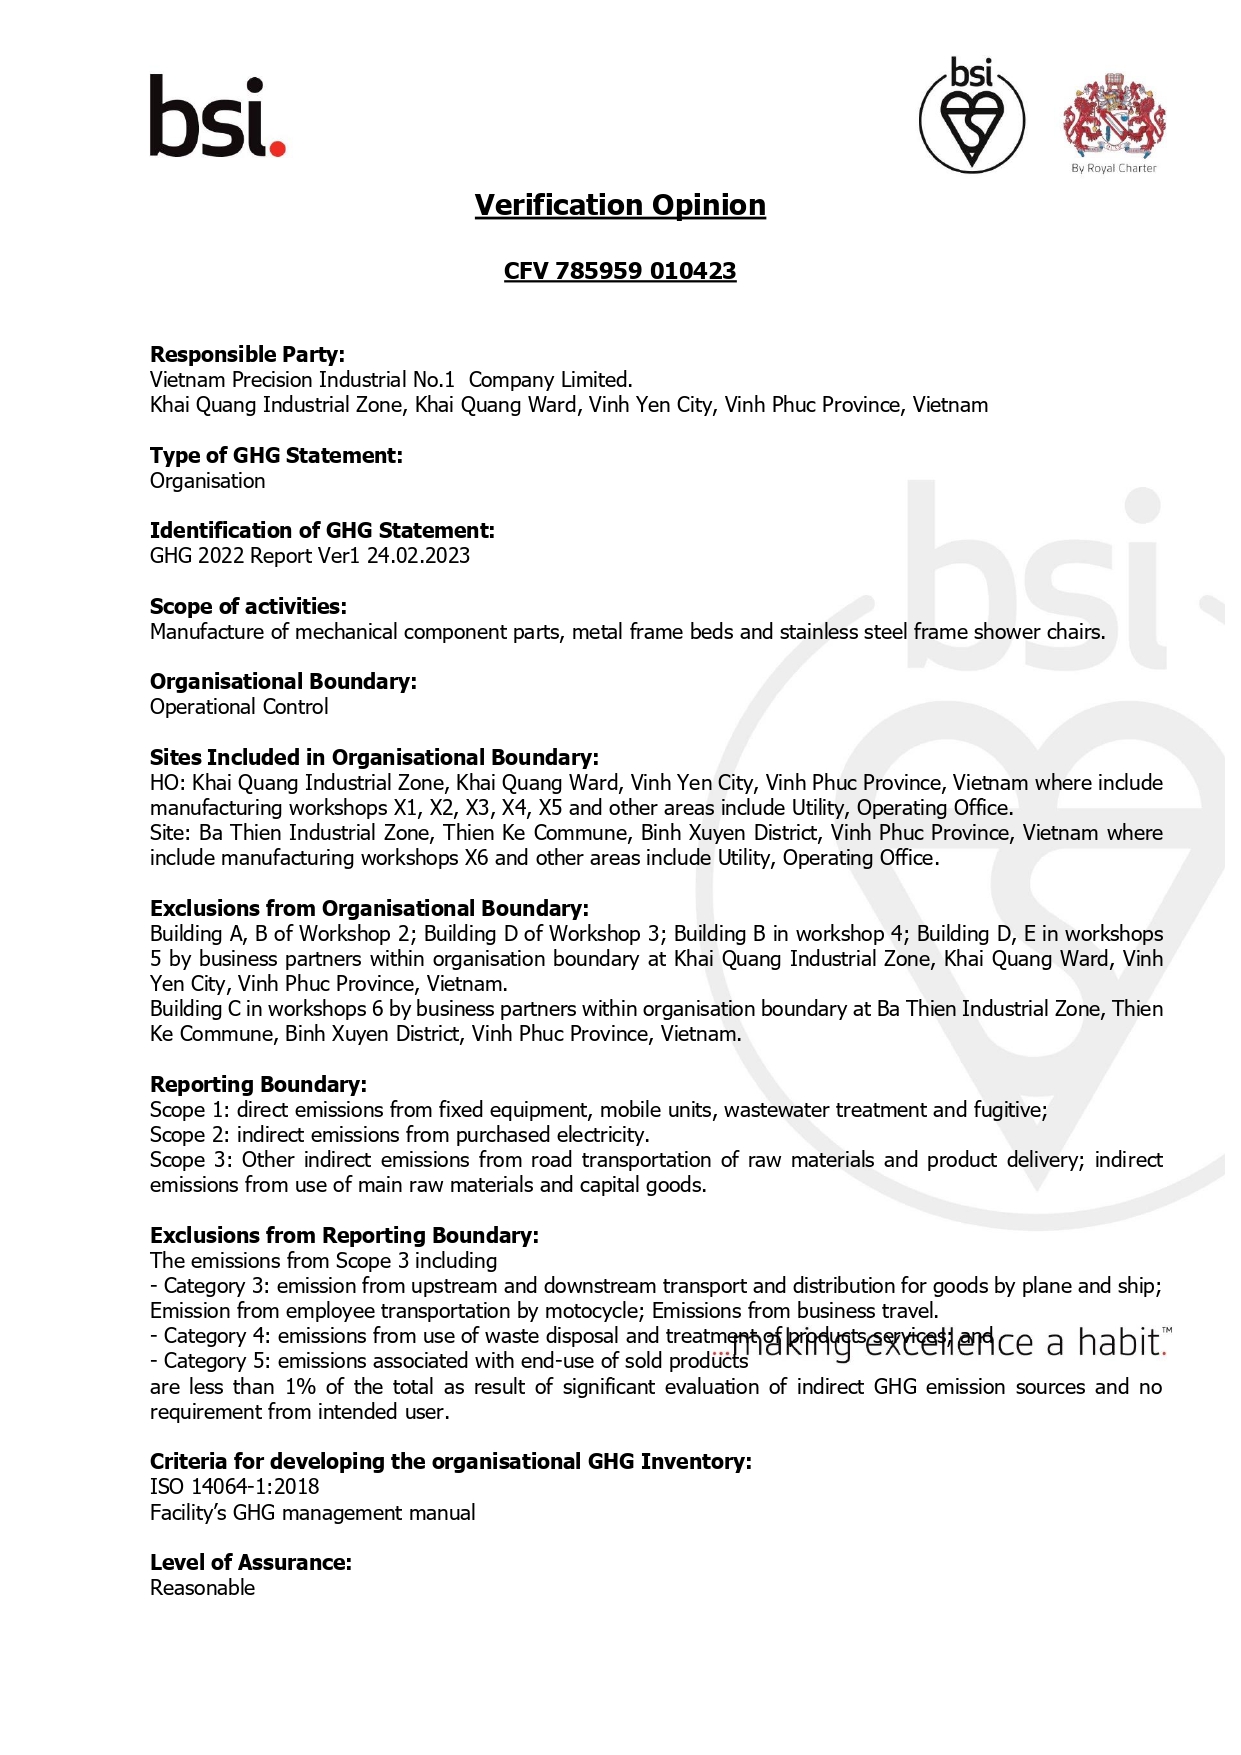
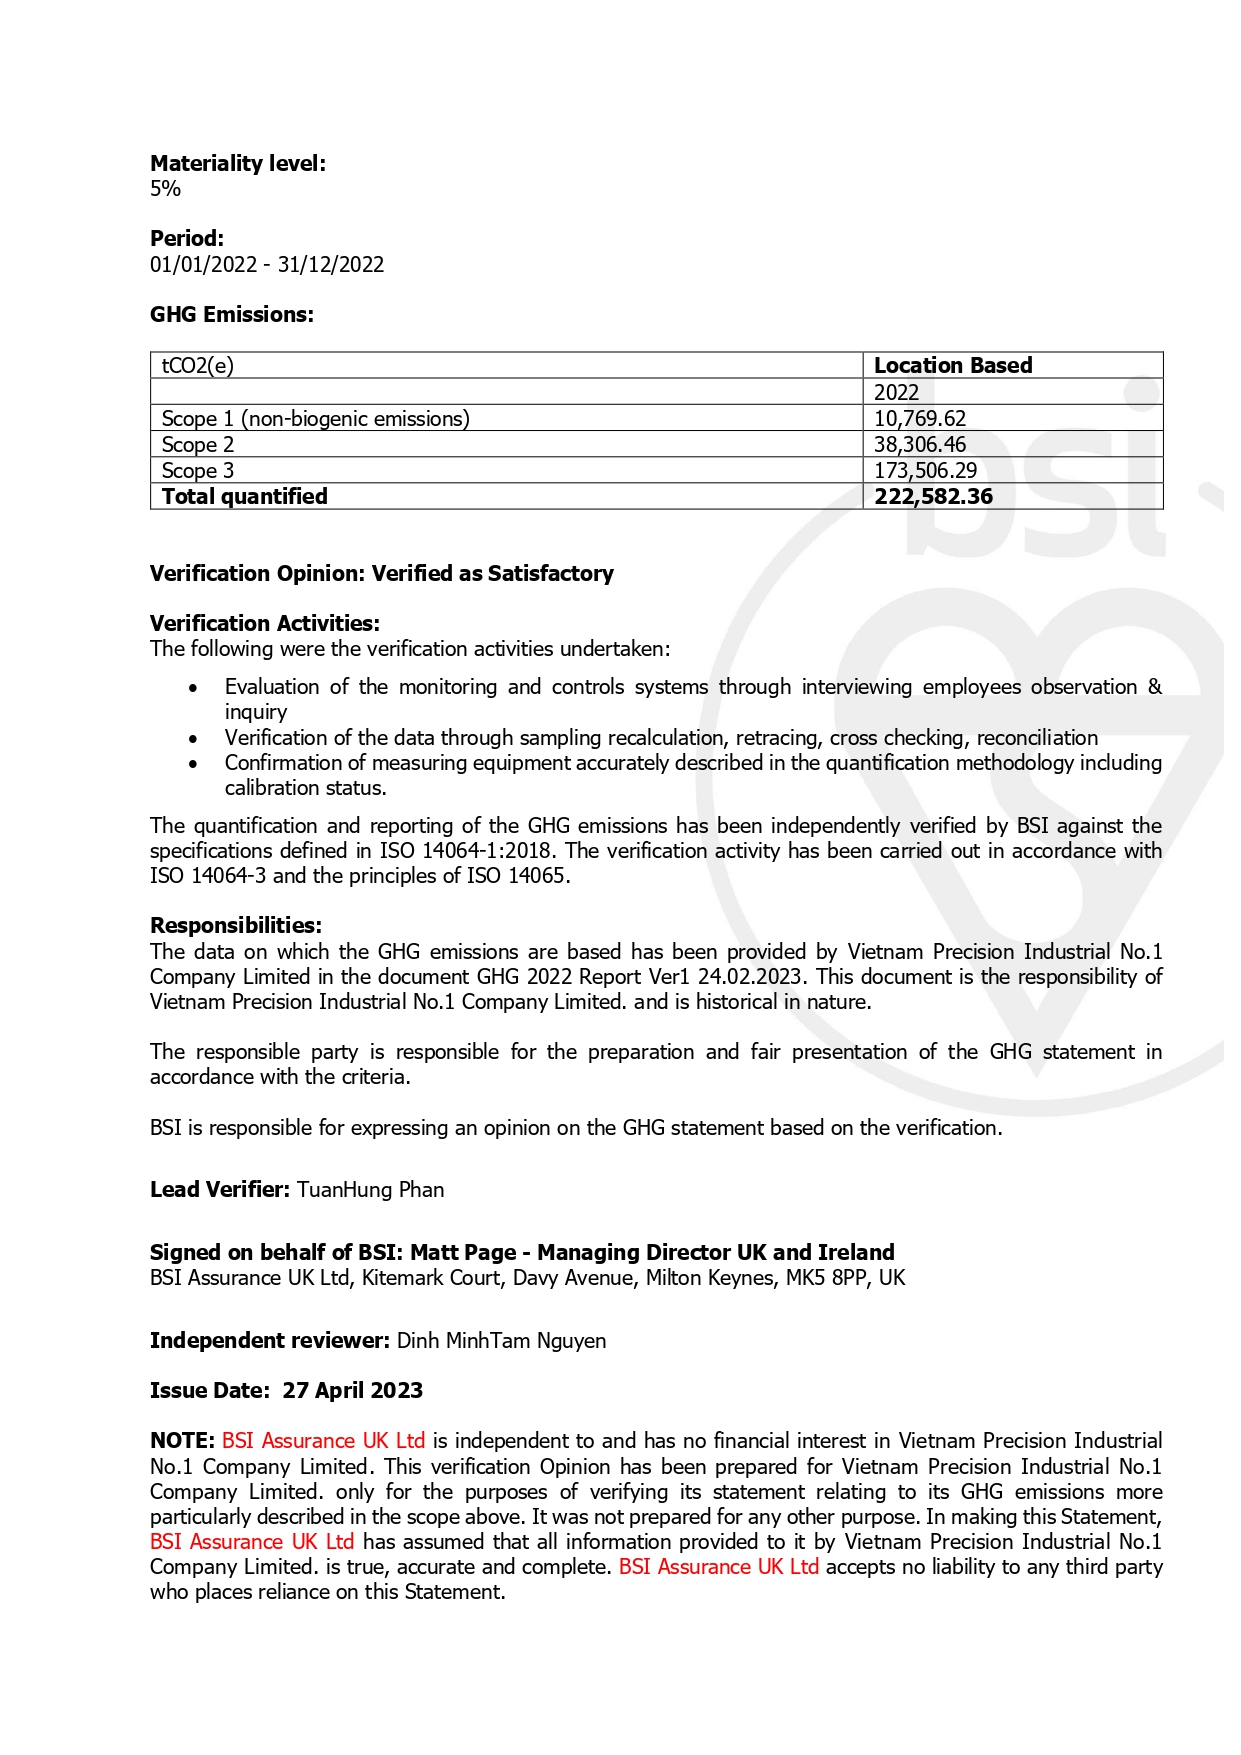
ISO 14064-1 Verification Statement(VPIC1)
Scope 1 Greenhouse Gas Emissions
| Item | Unit | 2020 | 2021 | 2022 |
| Scope 1 GHG emissions | ton CO2e | 2,423.93 | 2,006.65 | 10,826.1825 |
| Scope 1 GHG emissions Product intensity | tons of CO2e / production | 0.0326 | 0.0263 | 0.1226 |
| Scope 1 GHG emissions Sales intensity | ton CO2e / $ thousand revenue | 0.0005 | 0.0004 | 0.0014 |
Reducing CO2 emissions is currently the most pressing environmental issue worldwide. The primary source of greenhouse gas emissions for Eurocharm Group is electricity consumption. Therefore, energy efficiency is the primary carbon reduction goal for us. We continuously promote various energy-saving initiatives, with the year 2022 as the baseline. We strive to improve the efficiency of resource utilization by implementing measures such as switching to indirect lighting to reduce daytime lighting demand and centralizing the melting process of aluminum ingots to reduce CO2 emissions.
Scope 2 Greenhouse Gas Emissions
| Item | Unit | 2020 | 2021 | 2022 |
| Renewable | Degree | 0 | 0 | 0 |
| Grid Electricity | Degree | 36,589,544 | 46,118,422 | 53,297,152 |
| Product Intensity | Degree / Production | 491.75 | 604.57 | 603.45 |
| Sales Intensity | Degree / $ thousand revenue | 7.85 | 8.06 | 6.63 |
| Total Scope 2 GHG Emissions | Tons of CO2e | 13,214 | 20,903.12 | 38,432.9266 |
| Scop 2 GHG Emissions Intensity | Tons of CO2e / Production | 0.1776 | 0.2740 | 0.4352 |
| Scop 2 GHG Emissions Intensity | Tons of CO2e / $ thousand revenue | 0.0028 | 0.0037 | 0.0048 |
Scope 3 Greenhouse Gas Emissions
| Item | Unit | 2022 |
| Scope 3 GHG emissions | ton CO2e | 173,793.5423 |
| Scope 3 GHG emissions Product intensity | tons of CO2e / production | 1.9677 |
| Scope 3 GHG emissions Sales intensity | ton CO2e / $ thousand revenue | 0.0216 |
Total Energy Consumed
| Item | Unit | 2020 | 2021 | 2022 |
| Liquefied Petroleum Gas | GJ | 53,836.15 | 54,205.23 | 77,112.67 |
| Grid Electricity | GJ | 131,722.36 | 166,026.32 | 191,869.75 |
| Gasoline | GJ | 383.02 | 305.37 | 381.48 |
| Diesel fuel | GJ | 28,764.22 | 41,393.25 | 29,567.62 |
| Energy Total | GJ | 214,705.75 | 261,930.17 | 298,931.51 |
| Product Intensity | GJ / Production | 2.8856 | 3.4337 | 3.3846 |
| Sales Intensity | GJ / $ thousand revenue | 0.0461 | 0.0458 | 0.0372 |